Rodger Williams
August 12, 2020


Editor’s note: See Percentiles for help interpreting the graph.
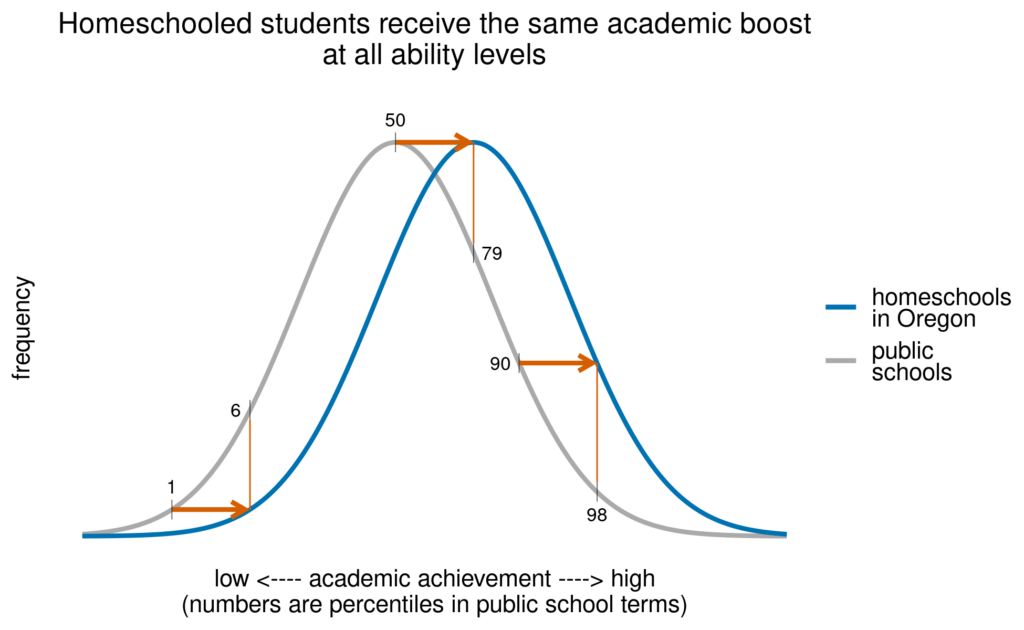
The graph compares the public school academic achievement curve on the left with the homeschool achievement curve on the right.
The red arrows reflect the difference in achievement between public schooling and homeschooling.
These arrows are all the same length since the homeschool curve is shifted as a whole to the right.
This means that homeschooled students traveling from the 1st percentile to the 6th percentile (measured on the public school curve) receive just as much of an academic achievement boost as those traveling from the 50th to the 79th.
Public schools are no substitute for homeschooling
Is this homeschool academic boost just the result of socioeconomic advantages among homeschooling families, as homeschool critics claim? No.
There is credible evidence that homeschooling academic successes cannot be explained by demographics alone.
Demographics appear to be overwhelmed by factors associated specifically with homeschooling. More research is required to clarify this phenomenon.
Critic assertions that “the children of parents who homeschool could fare at least as well in public school as they do in the private realm of the home” are just speculation. Homeschool critics offer no data to support these ideas.
The Oregon data
Why do we use Oregon data?
There is data showing Arkansas and Idaho, among other states, with above average homeschool academic achievement.
But Oregon has the only body of data which is detailed enough to allow us to estimate a reliable curve for homeschool standardized test scores. For further information on the data, see The Homeschool Effect in Oregon.

